For user-friendly findability
Data Visualisation
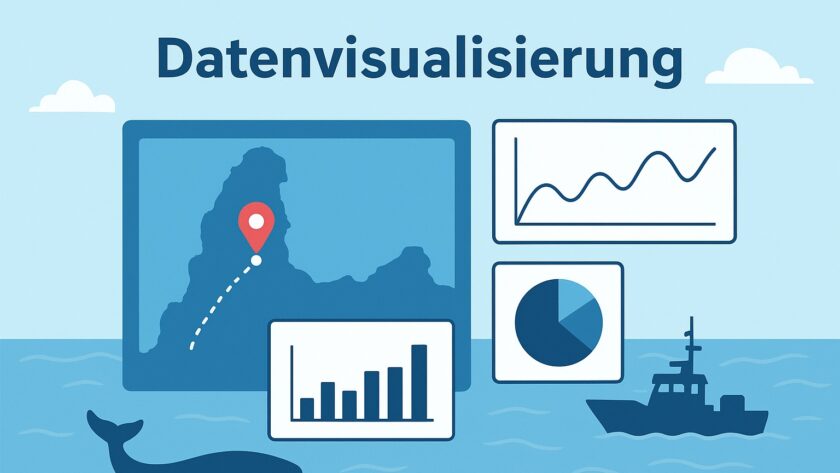
The visualisation of research data and metadata improves their findability and comprehensibility. Interactive representations facilitate access to complex information and promote the reuse of data in new scientific contexts.
The technical implementation of the visualisation is largely based on the development of the Alfred Wegener Institute’s spatial data infrastructure (SDI) as part of O2A: The Observation to Archive and Analysis Framework. During the development of the spatial data infrastructure, the German Marine Research Data Portal (https://marine-data.de/) was developed at the same time, providing centralised access to marine research data and expedition metadata.
A special feature of the portal are the viewers, which visualise (meta)data from various scientific disciplines on a world map (https://marine-data.de/viewers). The data is displayed via standard-compliant web services, which are provided by the AWI’s spatial data infrastructure (SDI), among others. This means that they can not only be integrated into specific websites – such as the German Marine Research Data Portal – but can also be accessed by third-party websites and local geoinformation system tools. This enables map-based (meta)data search and exploration.
In the ‘Underway’ research data project, a web service was set up specifically for fan echo sounder data (processed data and raw data) published in PANGAEA and for raw data from the Parasound sediment echo sounder. In addition, current raw data from 2D multichannel seismic systems are processed. These are made available through the PANGAEA Bathymetry Web Map (WMS) & Feature Service (WFS) and the PANGAEA Geophysics Web Map & Feature Service.
Our Sponsors
The federal government and the governments of the five northern German states support the current development and sponsor the DAM.